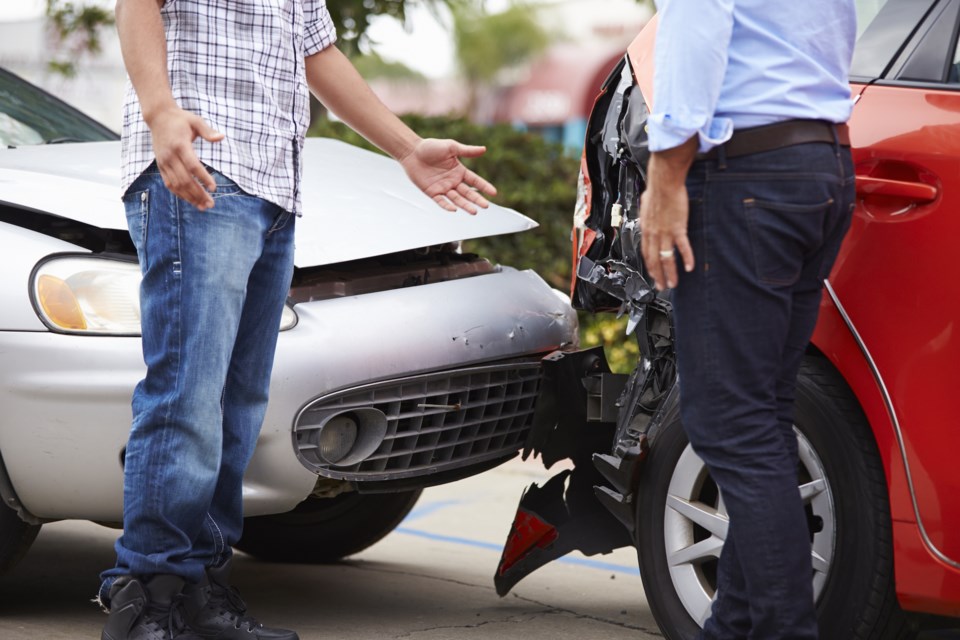
According to InsuranceHotline.com, Sault Ste. Marie drivers rank as some of the worst in the province. Based in information provided by auto insurance shoppers, the website measured driving ability on reported tickets, collisions, or a combination of the two. Sault Ste. Marie ranks in the top 10 worst cities in Ontario for driving based on these reports.
In terms of fender benders, we ranked third with 12.4 per cent of area drivers reporting a collision on their driving record within the last 10 years. Based on having both a ticket and a collision on their record in the last decade, the Sault ranked third behind Bradford and Orangeville with 8.4 per cent of drivers reporting both.
InsuranceHotline.com breaks the rankings down as follows:
Accidentally speaking
From a collision standpoint, overall 8.9 per cent of Ontario drivers admit to having been involved in a collision in the last 10 years. Yet, there are areas in the province where the average is two full percentage points higher.
| City/Town | % of Drivers with a Collision (No tickets) |
| Woodstock | 13.6% |
| Orleans | 12.8% |
| Sault Ste. Marie | 12.4% |
| Kanata | 12.3% |
| Gloucester | 12.2% |
| Whitby | 11.5% |
| Pickering | 11.5% |
| Brantford | 11.3% |
| Orillia | 11.2% |
| Burlington | 10.9% |
Double trouble
Having both a ticket and collision on your driving record is detrimental to your auto insurance premiums and approximately 3.5 per cent of Ontario drivers admit to having at least one of each in their relatively recent past. In 13 communities across the province, however, the average is 5.5 per cent or higher.
| City/Town | % of Drivers with both a Ticket and Collision |
| Orangeville | 9.4% |
| Bradford | 8.4% |
| Sault Ste. Marie | 8.4% |
| Woodstock | 7.4% |
| Brantford | 6.9% |
| Orillia | 6.6% |
| Cambridge | 6.3% |
| Thunder Bay | 6.3% |
| St. Thomas | 5.9% |
| Barrie | 5.9% |
| Welland | 5.8% |
| Oshawa | 5.6% |
| Pickering | 5.5% |
To review the full report from InsuranceHotline.com, please click here.
